
Introduction: Understanding Data Analytics and Insights (Even If You’re Not a Data Expert)
When I began my career in marketing more than 15 years ago, the word “data” didn’t get tossed around much in daily conversations. But today, it’s everywhere. If you are running a small business, or part of a large corporation, it doesn’t matter: Over and over again, I hear the refrain: “Data is power.”
They’re not wrong, but here’s the thing most people get confused about: data, analytics, and insights are not the same. I’ve seen this confusion at conferences, team meetings, and even with experienced managers. These words are often used as if they all mean one thing. But they don’t.
Think of it like this:
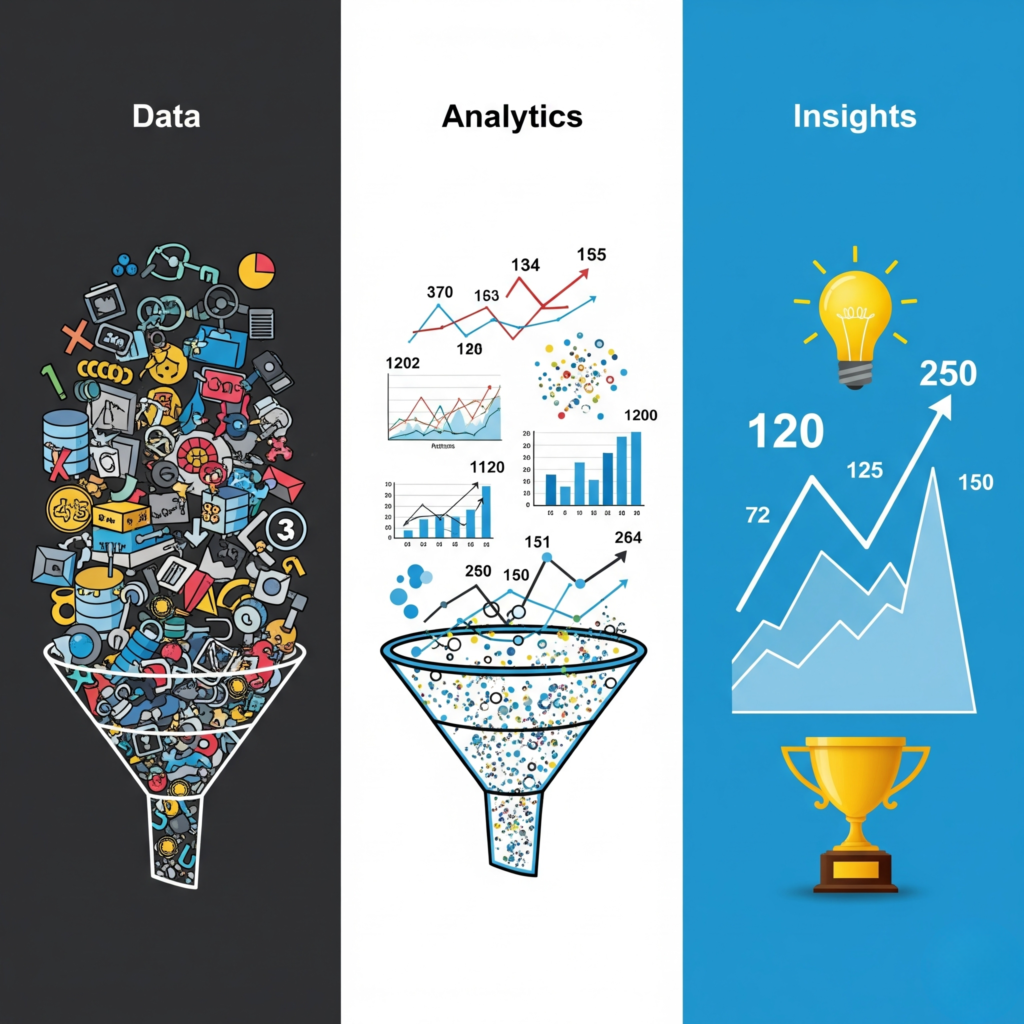
- Data is just raw information. Like a list of customer names, product prices, or website clicks.
- Analytics means doing the math and finding patterns in that data.
- Insights are the real “a-ha!” moments. The lessons that help you make smarter decisions.
During my time managing campaigns, one simple insight from our data helped me double conversion rates just by changing the layout of a signup form. But I only got there after organizing the data and understanding the patterns. That’s the power of using all three: data, analytics, and insights.
In this article, we’ll break down each part in clear, simple language. You’ll learn how to collect useful data, analyze it without needing to be a data scientist, and find insights that really matter to your business.
No buzzwords, no jargon. Just practical tips and real-world examples that will help you make better, faster decisions using data.
Let’s get started!
What is Data?
Let’s keep it simple.
Data is just information
It could be numbers, facts, or even clicks, anything that tells us what happened. For example, how many customers visited your website, how many bought something, where they came from, or what device they used.
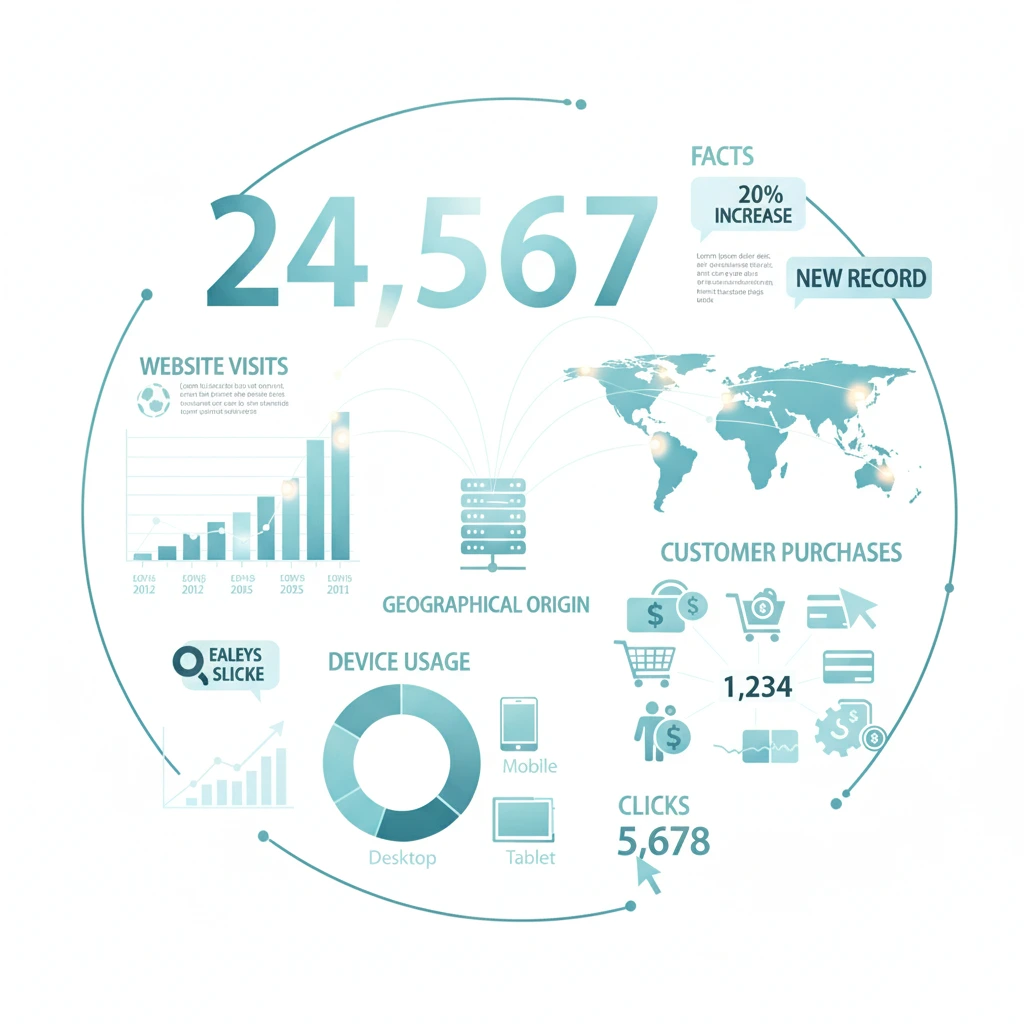
We all leave data behind every time we open an app, shop online, or like a post. That’s why businesses today are flooded with data. But here’s the catch:
Raw data alone doesn’t mean much
Let me give you a personal example.
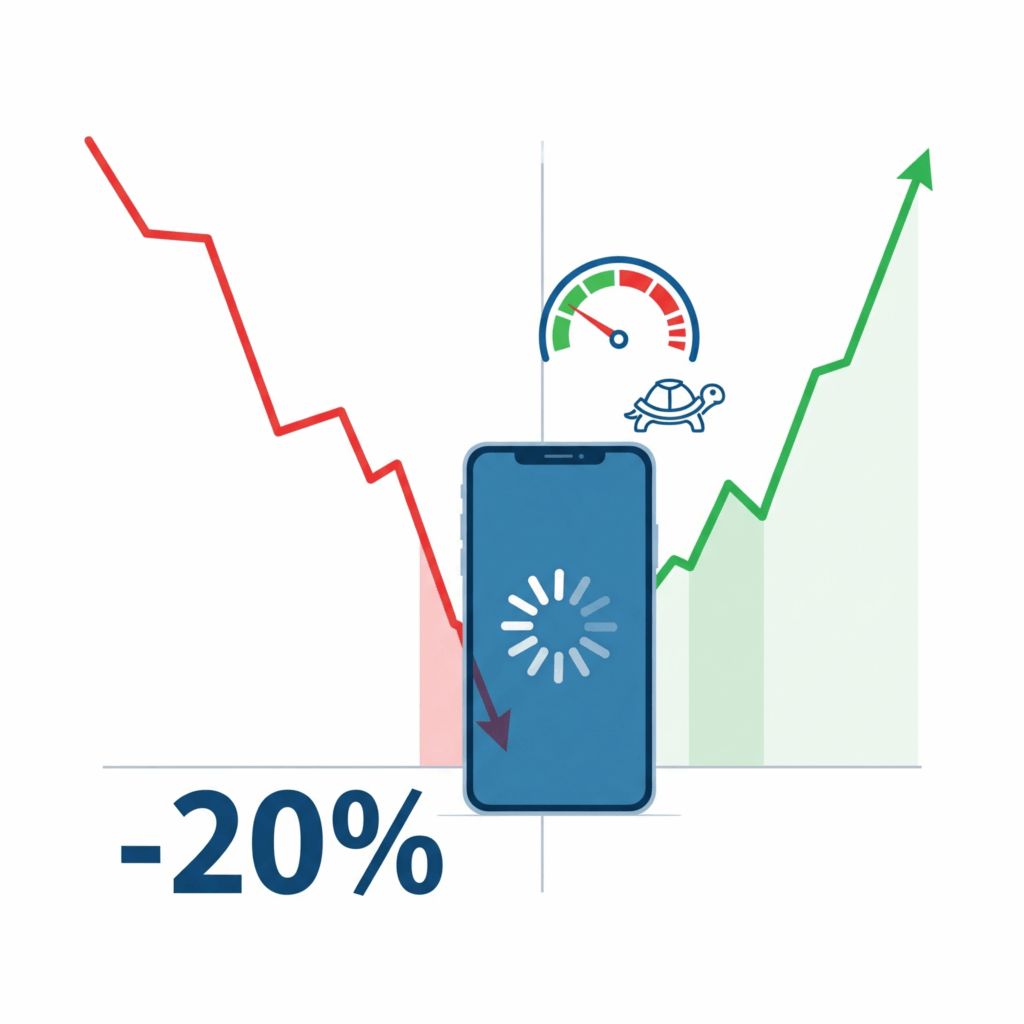
A few years ago, I managed a small online store. One month later, I noticed that sales had dropped by 20%. That number (the data) made me panic. But after digging deeper, I noticed something interesting: most of the drop came from mobile users. Why? The mobile version of the site was loading slowly. So, fixing the speed brought my sales back up.
What does this mean?
That data needs context. On its own, it’s just like puzzle pieces scattered on a table. To see the whole picture, the ‘why‘ behind the ‘what’, we need to connect those pieces.

How is Data Collected?
Businesses collect data in many ways, and it’s easier than ever today. They track customer purchases, survey responses, website clicks, social media likes, and even the duration of time someone spends on a page. All of these are pieces of the big puzzle.
There’s also something called big data, which is a fancy way of saying “a lot of complicated data”. Think of millions of users clicking around on apps, watching videos, or chatting on social platforms. To understand this type of data, businesses utilize specialized tools and software.
But no matter how much data you collect, what really matters is collecting the correct data.
For example, if you’re a gym owner, you might track member visits, class attendance, and cancellations. If you’re a restaurant, it may be due to factors such as order frequency, food preferences, or the location of your delivery.
Additionally, it’s crucial to store data securely, whether on dedicated servers or in the cloud. If your data isn’t safe or organized, you can’t rely on it later.

Analytics: The Process of Discovering Trends and Patterns
Analytics is the process of analyzing data and extracting key patterns and trends from it. This process enables businesses to transform raw data into actionable insights that inform critical business decisions. In essence, analytics shows how data can be leveraged to improve your business performance.
For example, imagine you own an online store and want to identify which products are selling the most. By using analytics, you can uncover purchasing patterns from customers and use this information to optimize your sales strategies and marketing efforts.
Why is Analytics Essential?
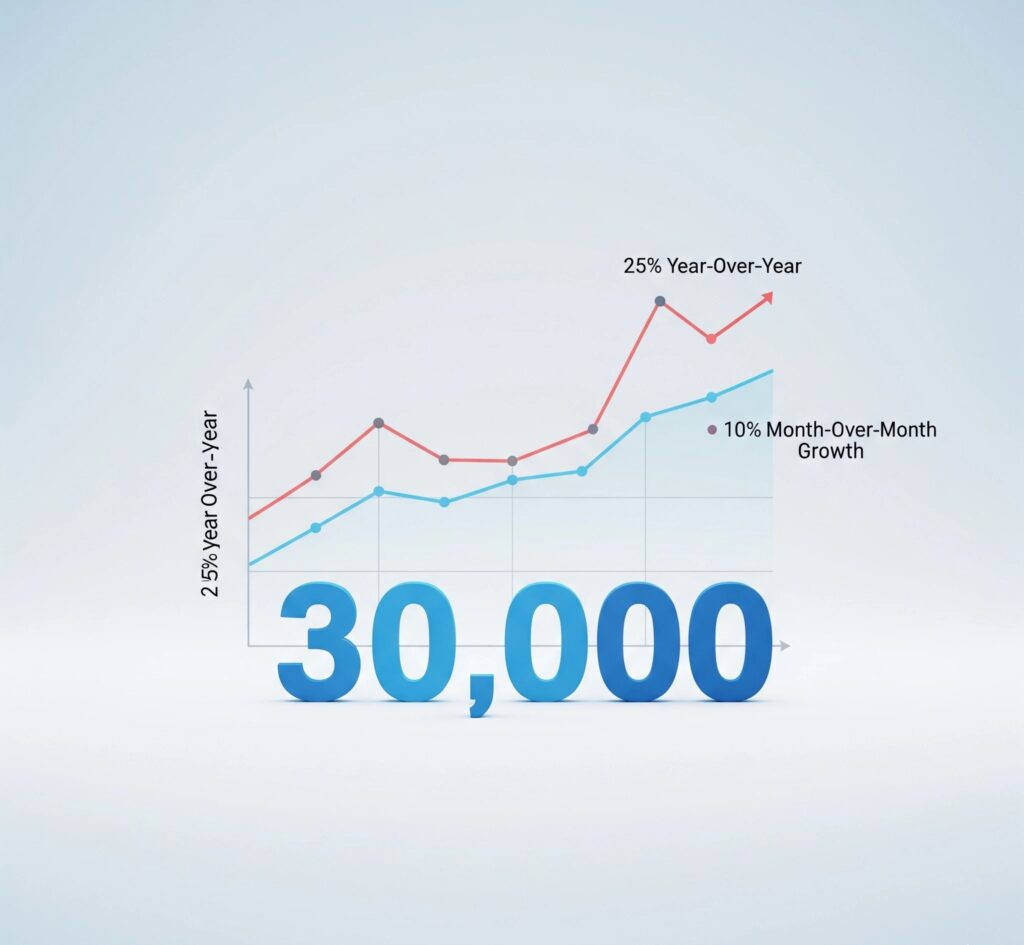
Raw data on its own can’t provide you with actionable information. It’s like a jigsaw puzzle,” he said, that needs to be assembled before it makes a picture that is full and complete.” As an example, let’s assume your website has 30,000 page views each month. Is this good? Bad? Is your website getting better, or do you need to reinvent the wheel here? Just looking at this one data point doesn’t tell us very much. However, if you see that your website traffic has grown by 25% year-over-year or 10% month-over-month, it provides valuable context and helps you understand whether your efforts have been successful.
Analytics Tools
There are various tools available for conducting data analysis. These tools range from simple software, such as Excel, to more advanced tools like Power BI or Google Analytics. These tools help you collect, process, and present the data in a way that is easy to understand and actionable through reports, charts, and dashboards.
A Personal Example
In my experience, when working on sales analysis for an online store, one product was selling very well, but we hadn’t done any marketing for it. Analytics showed that customers had a strong interest in this product, so we decided to launch a targeted advertising campaign for it. The result? Sales for that product increased significantly. This example illustrates how analytics can help you identify hidden opportunities within your business and capitalize on them.
Insights: Making Data Work for You
In the world of business, insights refer to the valuable knowledge you gain by analyzing data. These insights offer conclusions and predictions that can inform your decisions and strategies. Put, insights help turn raw data into actionable information that can improve your business performance.
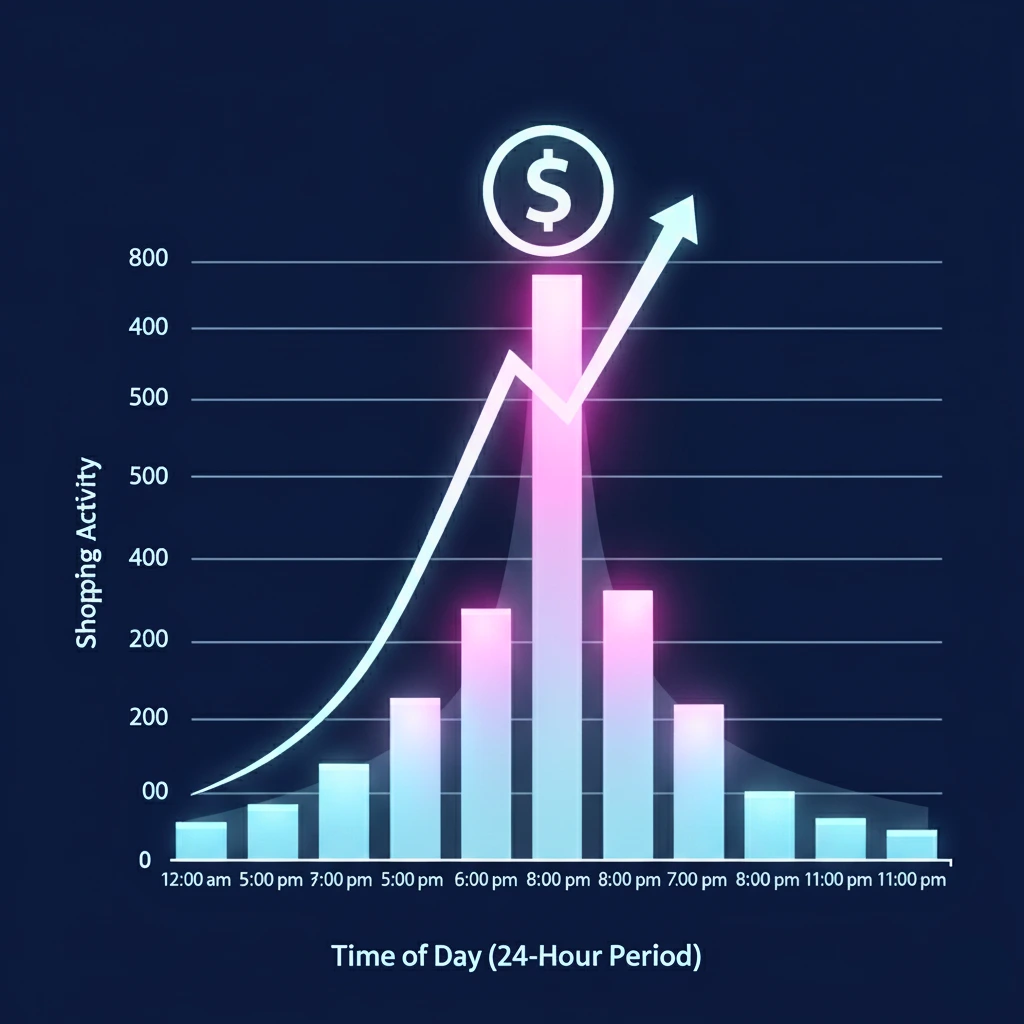
Let’s break it down with an example. Imagine you run an e-commerce website with an advertising campaign. By analyzing the data, you may discover that most of your customers tend to shop between 5:00 pm and 8:00 pm. Based on this insight, you could allocate more of your marketing budget to run ads during these peak hours. You could also reduce your ad spending during quieter times, saving money and focusing your efforts where they’ll have the most significant impact.
Why Are Insights Important?
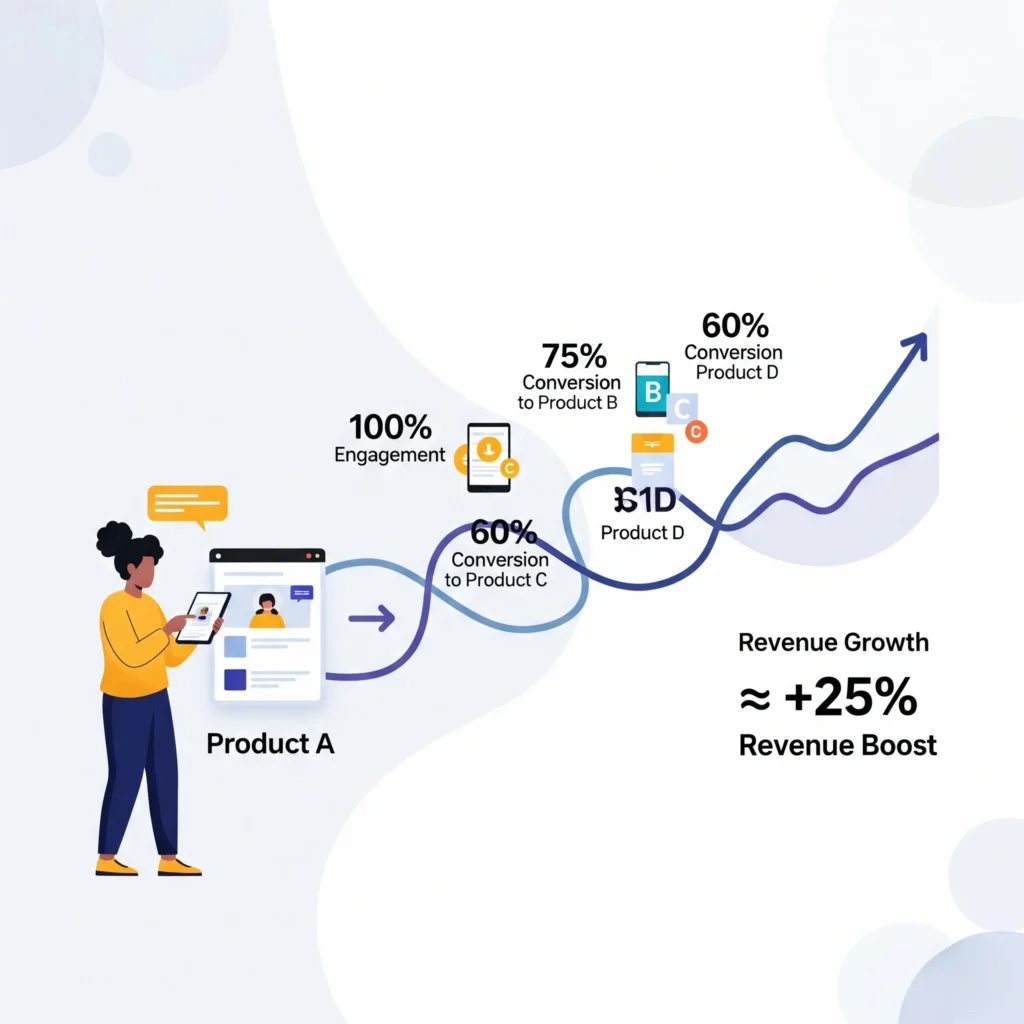
Data is just numbers and figures, without insights. But once you interpret that data, it discloses patterns, behaviors and trends that are essential to better business decisions. For example, you may learn through how sales of particular products that a client interacts with more often tend to lead to purchases of other similar products. You can use these insights to optimize your marketing plans, improve product recommendations, and boost revenue.
When I first began working with a local store in my neighborhood, for instance, we saw that sales would spike in the late afternoon. But we weren’t serving ads during those hours. Once we readjusted our ads and spent to reflect this information, the store experienced a significant growth in sales.
Turning Data Into Insights
Getting insights from data requires more than just gathering numbers, which require interpretation. You need to understand your customers: What do they want? How do they interact with your website? The answers to these questions come from analyzing the data and identifying patterns.
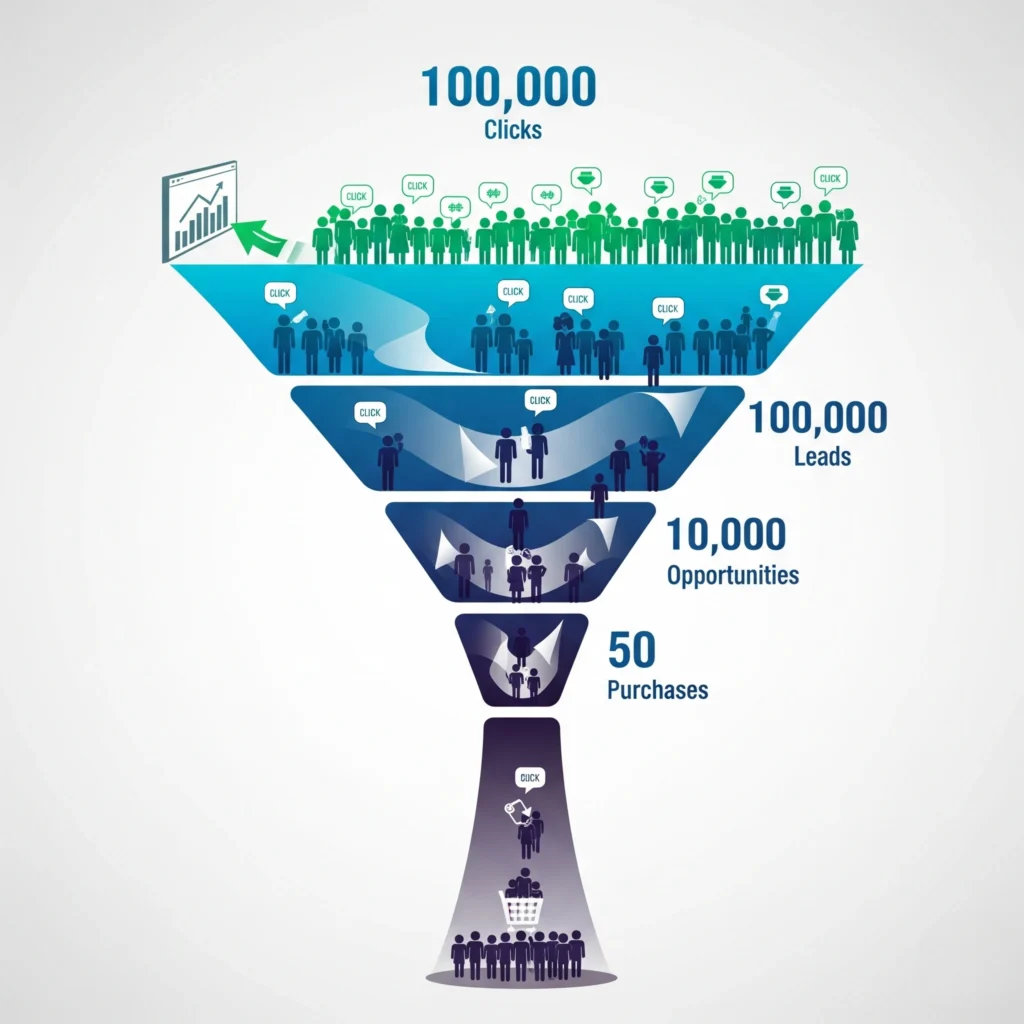
However, this doesn’t mean that every piece of data you collect will directly lead to an insight. You have to dig deeper and sometimes think critically about what the data is really telling you. For example, after running multiple ads for a new product, you might see that while a lot of visitors clicked on the ad, few made a purchase. This could be a sign that the ad itself wasn’t compelling enough or that the product description needed to be clearer. These are the kinds of insights that help improve your marketing strategy.
Insights vs. Reporting
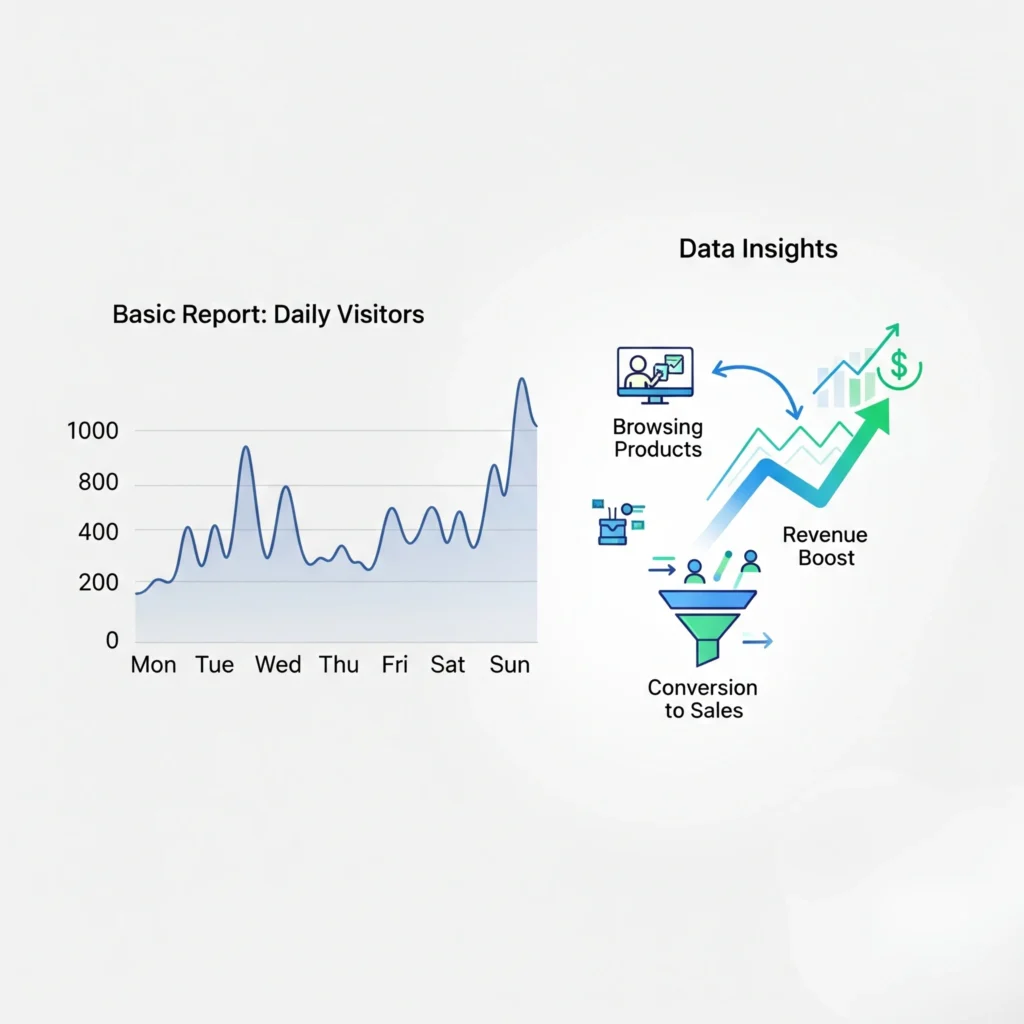
It’s also important to understand what insights are, and are not, when we talk about reporting. Reporting can just be the arranging and presentation of data often in charts or tables. In this respect, on the one hand, it’s just the data, and on the other hand, it’s the insights that one gets from analyzing that data. Insights are the “ah-ha” moments where you have the dots connected for you and valuable trends illuminate.
For example, you may have a basic report that would state the visitors to your website on each day. But insights would involve analyzing this data to understand when visitors are most likely to make a purchase, what products they tend to browse first, and how to convert those visits into sales.
The Power of Insights for Decision-Making
Insights are the driving force behind better decision-making. By combining data and analysis, you can create a clearer picture of what’s going on in your business. This can guide you in adjusting your strategies, improving operations, and providing a better experience for your customers.
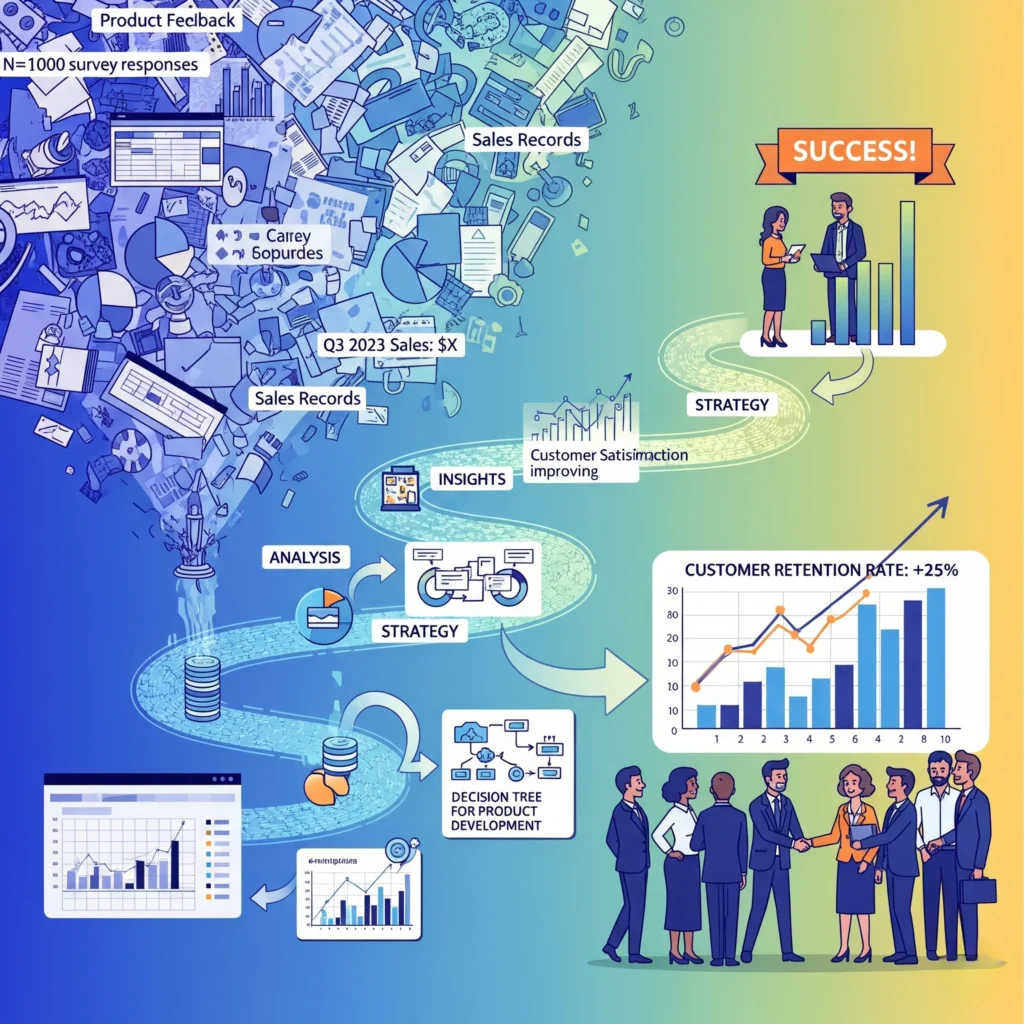
Using insights has been crucial in making more informed and intelligent decisions. Example: through analyzing product feedback and sales records, I was able to pinpoint decisions around product improvement that had improved our customer retention rate. Without that understanding, we would have been left guessing at what customers really wanted.
Data, Analytics, and Insights: A Comparison
There are a few specific differences between data, analytics, and insights.
To actually get value out of information, you must understand the differences between data, analytics, and insights. They sound alike, but have roles to play in helping business growth. Let me break it down in a simple way.
1. Data: The Raw Material
Data is just raw information. It hasn’t been cleaned, sorted, or explained yet. It could be anything: website clicks, customer purchases, user reviews, or even how long someone stays on a page.
Think of it like vegetables in your kitchen. Before cooking, they’re just ingredients. That’s what raw data is: unorganized.
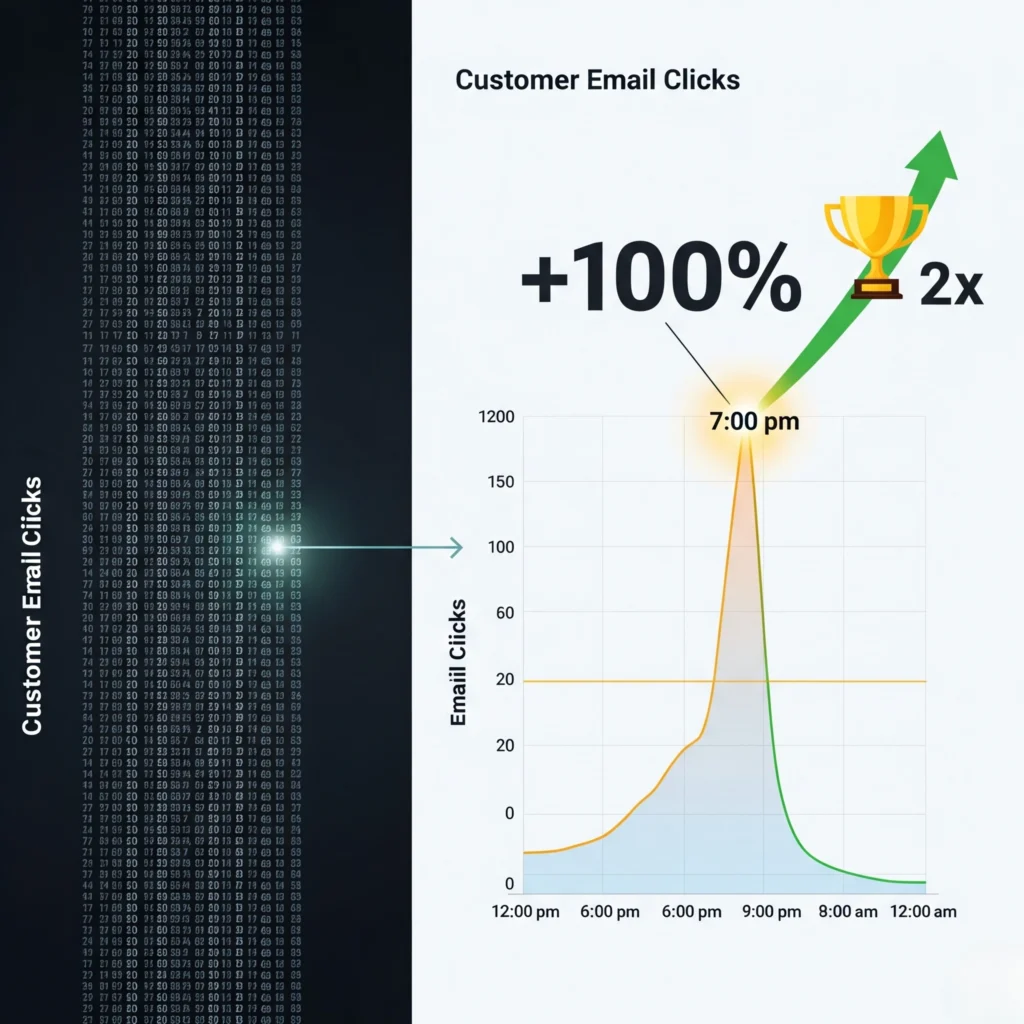
For example, in my most recent project, I had a lengthy list of customer email clicks. It didn’t tell me much at first, just numbers. That was data.
2. Analytics: The Cooking Process
Analytics is what you do to the data. It’s the process of organizing and analyzing it to find patterns or trends. You might compare data over time or by location, customer type, or device used.
It’s like cooking. You take your raw ingredients (data) and follow a recipe (method) to make something useful. With analytics, you start to understand what’s happening in your business.
When I organized the click data by time of day, I found that most users clicked between 6:00 and 9:00 pm. That was analytics at work.
3. Insights: The Final Dish
Insights are the final result. They’re the “Aha!” moments. After analyzing the data, you realize something important, something you can act on.
Insights help you make better decisions. They answer questions like:
- Why are customers leaving the site?
- What is the best time to send emails?
- Which product is selling the most and why?
In my project, the insight was clear: sending emails at 7 pm doubled the open rate. That insight helped improve our next campaign.
Why Do These Three Matter?
You need all three steps:
- Data gives you the facts.
- Analytics gives you understanding.
- Insights guide your actions.
Without good data, your analysis will be wrong. Without proper analysis, your insights will be useless. And without insights, you won’t know what to change in your business.
The Role of Each in Business Strategy
(Data, Analytics, and Insights in Real Life Business Decisions)
In the fast paced environment of today, there are lot of challenges business leaders need to deal with: emerging technologies, climate change, economic shifts and political uncertainties. For nurses to make the right decisions in such often overwhelming circumstances, they need something more concrete than gut instinct. That’s when data insights and analytics can be most powerful.
Let’s break it down in simple terms:
1. Data: The Raw Ingredient
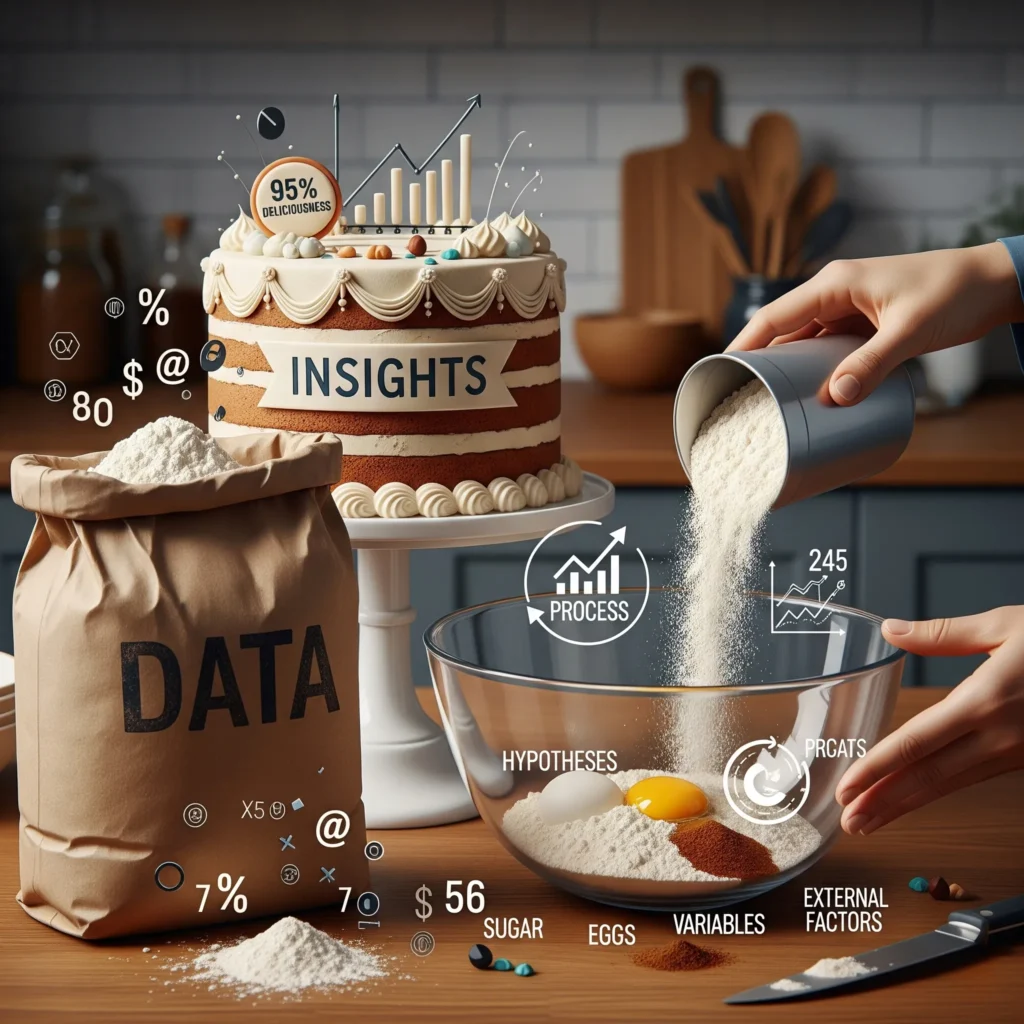
Data is the flour in the baking recipe analogy, the basic ingredient. When, for instance, I ran my own tiny site, I had all kinds of data at my fingertips, from customer orders and website clicks to Instagram comments. But all this information on its own didn’t show me what to do next. In the end, it was just numbers and chronicles.
2. Analytics: The Recipe
Analytics is where you take the raw data and do something useful with it. It’s like mixing ingredients and baking the cake. Then it turns into a cake, putting the first ingredient in and mixing it all together. I remember using basic tools like Google Analytics to analyze what products got the most clicks yet were not selling. What was interesting was that analysis led me to see how opaque my product descriptions were and fixing that translated into more sales.
3. Insights: The Final Dish
Insights are the results that help you take action. It’s the “aha!” moment. For example, one day I noticed that many people were abandoning their carts at checkout. After digging into the data, the insight was clear: shipping costs were too high. So, I tested free shipping for orders over $50 and sales improved in just one week.
Why is this Important for Your Business?
In business strategy perspective, the data analytics and insights will allow you to:
- Understand what’s really going on
- Anticipate the future (what customers might want next)
- Discover latent issues (before they cost more)
- Make smarter decisions, not just fast ones
It’s not just about looking back. It’s about building the future. Innovative businesses utilize data analytics and insights not only to react but also to plan, grow, and lead.
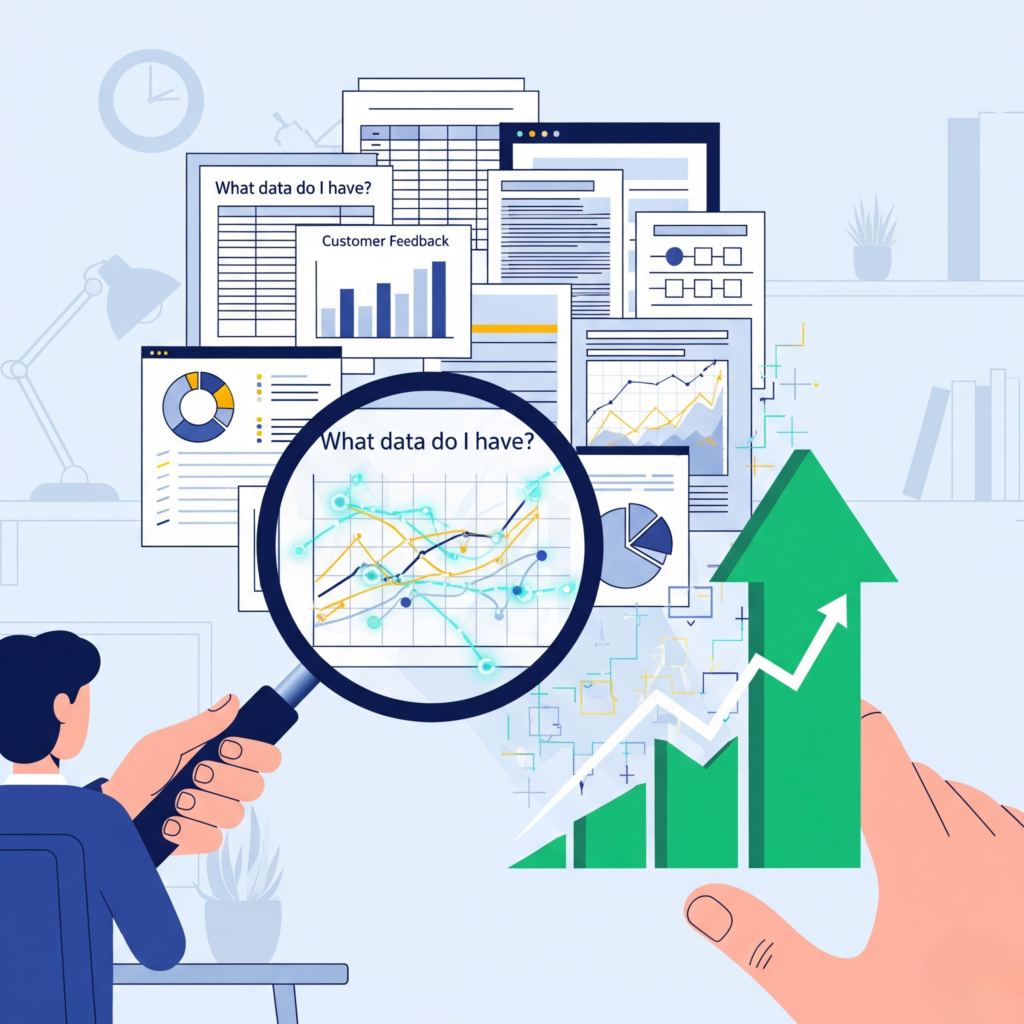
Real Tip: Whether you run a small shop or lead a big company, start by asking this:
“What data do I already have, and what can it tell me if I look closely?”
That one question can completely change how you make decisions.
Final Summary: The Difference Between Data, Analytics, and Insights and Why They Matter for Your Business
In today’s world, everyone is talking about “data.” From managers in big companies to small business owners, everyone says:
“Data is power.”
However, the truth is that having data alone isn’t enough. You need to know how to use it. That’s why three important terms exist:
1. Data: Just Raw Information
Data connote unprocessed, unorganized pieces of information. Examples could be the count of users of a website, the time a buyer makes a transaction, or what item has the highest number of clicks. Alone, data, like siloed ingredients of a recipe, has no real significance.
2. Analytics: Analyzing and Finding Patterns
Analytics involves examining the data closely and identifying patterns. For example, most customers buy between 6 pm and 9 pm. Or, you may discover why a product isn’t selling well. This step is like cooking you take the raw ingredients (data) and mix them to make something useful.
3. Insights: Actionable Results You Can Act On
Insights are the results you get from analyzing the data that help you make decisions. For example, if you realize most of your sales happen in the evening, you could increase your ad budget during those peak hours. Alternatively, if you discover that high shipping costs are causing customers to abandon their carts, you could offer free shipping above a certain threshold. These insights help you take action.
FAQ: Understanding Data, Analytics, and Insights
1. What is the difference between data, analytics, and insights?
- Data is raw information, like numbers, clicks, or customer details. It doesn’t tell you much on its own.
- Analytics involves identifying recurring patterns and extracting valuable data from trends and records.
- Insights are the products of this kind of reflection and as such are very valuable because they inform decision-making and enhance effectiveness in business.
2. Why is data alone not enough to make sound business decisions?
Data is just raw information. To turn data into something useful, you need to analyze it to find patterns. Insights are derived from analyzing data, and they are the key to making informed, more intelligent decisions.
3. How can businesses collect data?
Businesses collect data through various methods, such as tracking customer purchases, website clicks, social media likes, and even the duration of customer page visits. They can also use surveys and customer feedback.
4. What tools can be used for data analysis?
There are many tools available for data analysis. Some simple tools include Excel and Google Analytics, while more advanced ones, such as Power BI or Tableau, offer more in-depth insights.
5. How can analytics help improve business performance?
Analytics helps businesses understand trends and patterns. A business can, after behavior observation, tailor their advertising, enhance their merchandise, or boost their revenues.
6. Can You Provide an Example Where Insights Altered A Decision Within The Business?
Definitely! A local shop realized that they were doing much more business than usual during evening hours. By leveraging insights from this data, they adjusted their ad budget to target those peak hours, resulting in a significant increase in sales.
7. What is the role of insights in decision-making?
Insights help you make better, more informed decisions. For example, you might discover that certain products are more likely to sell together, so you adjust your marketing to highlight those products together.
8. How is Insights different from reporting?
Reporting involves presenting data in graphs or tables. Insights involve extracting trends or patterns from data, and understanding them enough to make informed business decisions.
9. Why is it critical to integrate data, analytics and insights?
All three are required. Data is the raw information, analytics is the diagnosis, insights are the prescribed actions to make informed decisions.
10. What’s a good starting point for using data in my business?
Start by asking: “What data do I already have, and how can it help me?” This will help you understand what you can learn from the data you already collect and how to utilize it to make more informed decisions.
11. How does data help businesses predict future trends?
By analyzing past data, businesses can identify trends and accurately predict customer behavior. This can guide business strategy and help companies to stay ahead of the competition.
12. Can small businesses benefit from using data and analytics?
Absolutely! Data and analytics can help you better understand your customers, improve your marketing efforts, and make better decisions to propel business growth, regardless of how big or small your business is.
13. What is the best way to store data?
Either on secure servers or in the cloud, data should be kept safe. For the data to be accessible and utilized efficiently, it must be well-organized.
14. How do I make the most of my data?
Prioritize gathering precise data and applying analytics to spot trends and patterns. Make use of these insights to improve your performance by honing your business strategies and making wise decisions.
