
User Behavior analytics is about understanding your customers inside out.
Imagine an amusement park that you happen to manage; you can see people at the entrance walking and choosing which one they’d enjoy. Certain individuals head directly to the famous attractions.
Others seem confused as they leave the first corridor. They walk toward the exit without enjoying anything. And you’re on the executive level—you witness this directly, fully conscious of what is effective and what is not.
As the manager of a website or app, direct observation of user interactions is not possible. You can’t see where users face confusion, which functionalities they overlook, or their reasons for potentially abandoning the platform.
This is where User Behavior Analytics proves useful. It offers insights to understand what’s profoundly happening on your website or app—insights you would not find.
With User Behavior Analytics, you will clearly see how users interact with your platform. You can track where they click, how they move between pages, and where they leave. This data brings the user experience into focus, enabling you to spot points of friction and areas for improvement.
What is User Behavior?
Instead of just guessing why users leave their carts or miss important content, you will know what stops them. You will see what prevents them from finishing their purchase journey.
User behavior includes all the actions visitors take on a website. This includes where they click and how they scroll. It also examines the sections where they encounter difficulties and the pages they exit. You track all these activities and thus understand better how users interact with your site.
What is User Behavior Analytics (UBA)?
UBA means collecting and analyzing numbers and personal feedback. This helps us see how users interact with a product or website. It also helps us understand their reasons.
youtube videos
Tools like Google Analytics show what happens on your site. They tell you how many people visit and where they leave. However, they frequently neglect to explain the “why.”
For example, UBA can help answer key business questions. These questions are: “What brings visitors to my site?” and “What prevents them from buying before they leave?” With this detailed insight, you can make smart choices. These choices will improve user experience and boost conversions for your website or product.
It helps you see user behavior better. This lets you improve the customer journey on your website.
Who is Behavior Analytics For?
Behavior analytics is a valuable tool for professionals who want to improve user experiences and achieve better results:
- Product Managers: To understand how users interact with their product and identify areas for improvement.
- Website Owners: To optimize website performance and increase user engagement.
- Data Analysts: To analyze user behavior and uncover actionable insights.
- UX Designers: To create intuitive designs based on real user interactions.
- CRO (Conversion rate optimization) Managers: To identify bottlenecks in the user journey and improve conversion rates.
- Digital Marketers: To refine campaigns and measure their impact effectively.
What are the best tools for user behavior analytics for better website and app performance?
Effective user behavior analytics tools hold the key to better performance for your website or app. You can learn more about how users interact with your site. Use session recordings, heatmaps, and event tracking tools.
Now, let’s explore each of these methods in detail to explain how they can help you make better decisions:
Session recordings:
I watched some session recordings from an e-commerce site. I noticed that many users kept typing their email in the email field on the payment page, but then they would delete it. This happened in several sessions.
I noticed that the design of the email field made users think they had to enter an email. It caused a significant problem for users. After changing the design, the payment completion rate improved a lot.
This made me realize how useful session recordings are for finding and fixing user experience problems.
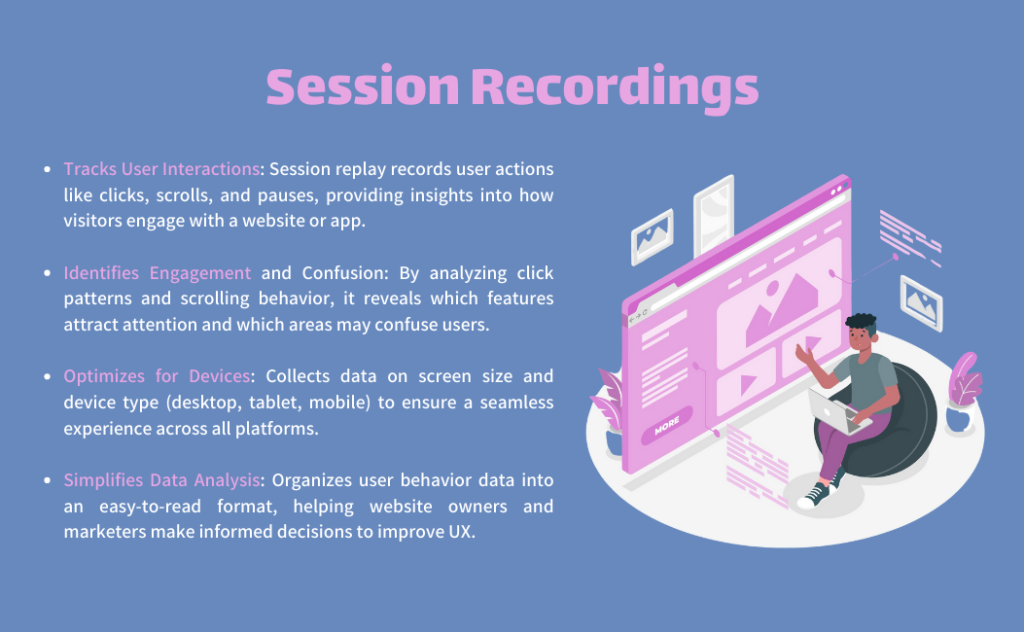
Session replay, also known as session recording, is a useful tool. It helps track and record how users interact with a website or app. This technology records many user actions, giving useful information about how visitors interact with online content.
A main feature of session replay is to monitor where users click. This means that every time a user clicks a button, link, or any interactive element, the tool tracks that action.
By looking at click patterns, owners can see which features are engaging. They can also find areas that may confuse users. This helps them understand how well users navigate the site.
In addition to clicks, session replay also monitors scrolling behavior. This also tracks how much users scroll down a page, how fast they scroll, and if they pause to interact with certain content. Understanding how users scroll can help website owners see if their content keeps attention. This can indicate whether we need to make changes to improve the user experience.
Additionally, session replay tools collect data about the screen size of the user’s device. This includes details like whether the user is on a desktop, tablet, or mobile phone. It also covers the size of their display. This data is important for improving website design and function on different devices. It helps all users have a smooth experience, no matter how they access the site.
After collecting this data, the team organizes it and shows it to the platform owner in an easy-to-read format. This helps website managers and marketers study user behavior closely.
Heatmaps:
A heatmap is a valuable tool that allows you to monitor user interactions on your platform. This information is particularly beneficial for those in product management or UI design roles. It helps you understand which parts of your online store attract the most focus.
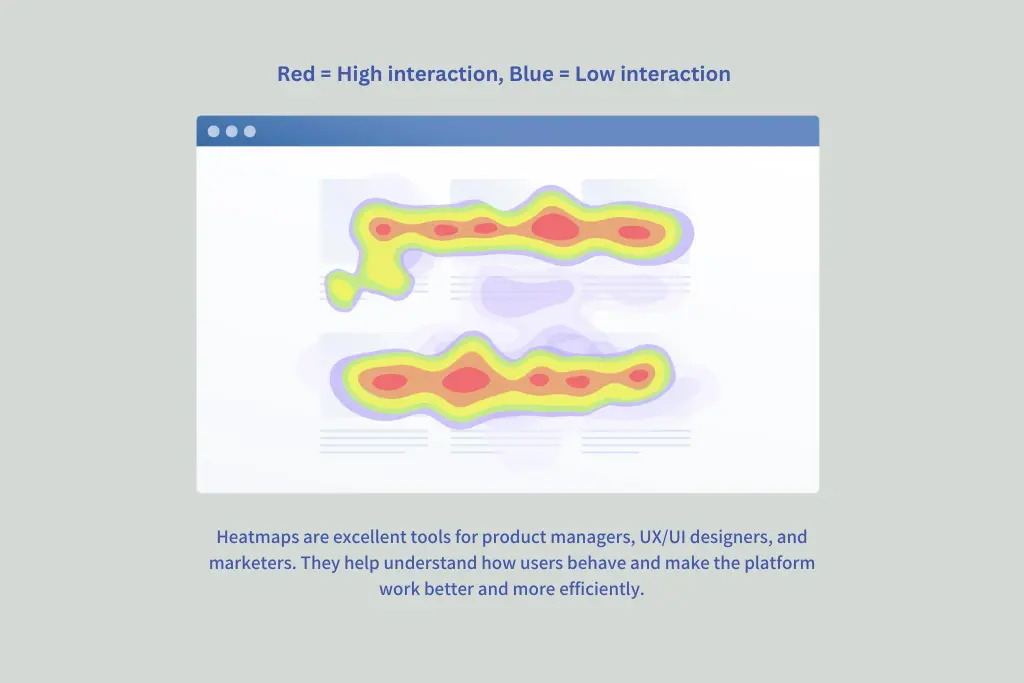
Heatmaps are excellent tools for product managers, UX/UI designers, and marketers. They help understand how users behave and make the platform work better and more efficiently.
I’ve found heatmaps to be incredibly helpful for understanding user behavior.
I was tweaking a product page and decided to check a heatmap. After noticing that users weren’t scrolling far enough to reach the key button, I moved it higher on the page. As a result, clicks increased, leading to a boost in sales.
By analyzing scroll maps, I noticed users weren’t reaching the end of the content. To address this, I now position key points and images closer to the top for better engagement. Heatmaps don’t explain *why* users act a certain way, but they’re a helpful tool for improving my designs and content.
Key Features in Heatmaps:
Visual Representation
Heatmaps use colors to show which parts of a webpage get the most attention from users. Red means high activity (lots of interaction), and blue means low activity (little interaction).
Real-time tracking
Heatmaps visually show how users interact with your platform in real time. This is especially useful for making quick adjustments during A/B tests or product launches.
User behavior insights
Use heatmaps to see which parts of your website or app users focus on and which areas they avoid or find problematic.
Easy Data Understanding
A heatmap, as opposed to in-depth analytics reports, presents a basic visual overview of user behavior. It saves time, makes it easy to draw conclusions, and turns them into actionable solutions.
Growth and Optimization Zones
Heatmaps highlight areas for improvement, such as redesigning weak sections, relocating call-to-action buttons, and streamlining navigation.
Goal Conversion:
All product managers and digital marketers want to succeed, whether by increasing sales, improving engagement, or keeping users longer.
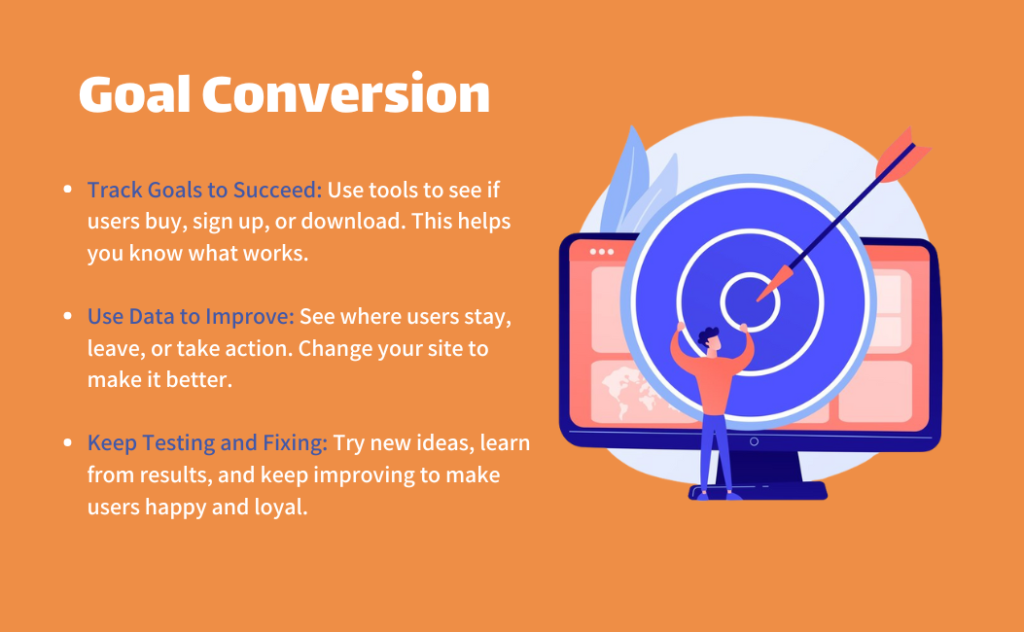
If you run an e-commerce, your goal is to make visitors take action—like buying, signing up, or downloading. This is where Goal Conversion Tracking becomes a helpful tool for your strategy.
When I first tracked user behavior on my e-commerce site, watching “Buy Now” clicks turn into actual sales felt huge. Each conversion was a small win, proving my strategies mattered. Seeing visitors become customers was rewarding—it confirmed I was building an experience that worked.
But it wasn’t just about the wins. The data became my guide for improvement. I studied which pages held attention, where users lost interest, and what pushed them to act. These insights let me tweak layouts, simplify steps, or adjust messaging—continuously refining the journey.
Over time, it became a cycle: learn from the data, make changes, then learn again. Every conversion taught me something new—what clicked with users and what flopped. This loop of testing and refining kept the site evolving, turning casual visitors into loyal buyers.
Impact of user behavior analytics on funnels:
Funnels help businesses see how people move through their website or app. Imagine a real funnel—wide at the top, narrow at the bottom. Similarly, a digital funnel tracks users as they complete steps (like buying a product). Not everyone finishes all steps, so funnels show where people leave and why. This helps teams fix problems and create better experiences.
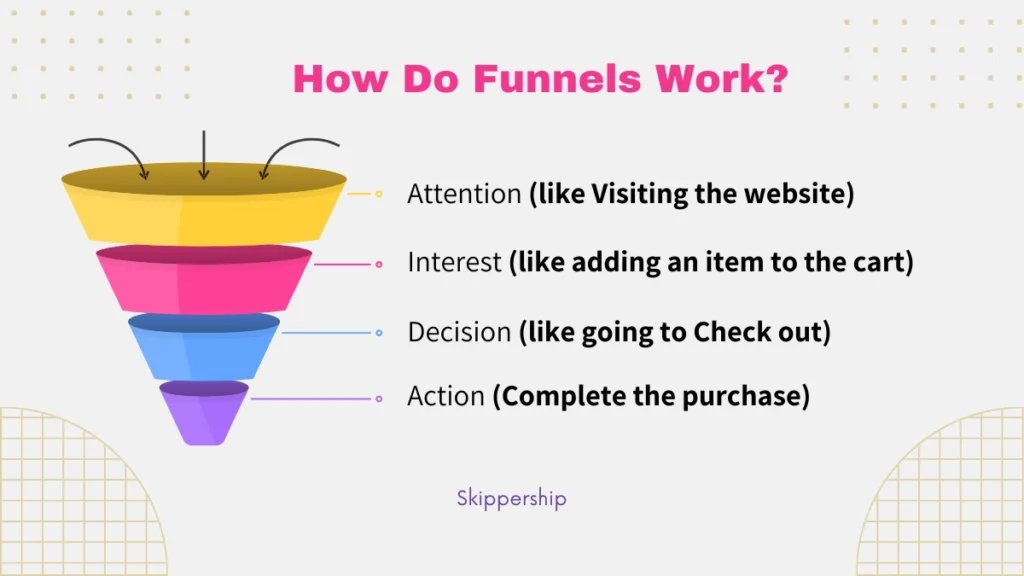
How Do Funnels Work?
A funnel has stages, like steps in a journey. For example:
- Visit the website
- Add an item to the cart
- Check out
- Complete the purchase
The number of users decreases at each stage. If 1,000 people visit a site, maybe 500 add items to their cart, 300 check out, and 200 buy. The biggest drop-off (from 1,000 to 500) shows where to focus improvements.
Why Are Funnels Important?
Funnels give both numbers (like drop-off rates) and clues about why users leave. For example, pairing funnel data with tools like session replays (recordings of user actions) can reveal issues like confusing buttons or slow loading pages. Fixing these issues can boost sales or sign-ups.
Tips for Better Funnel Analysis
- Break big funnels into smaller steps to find exact problems.
- Compare new vs. returning users to see different behaviors.
- Use tools that explain why users drop off, not just where.
6 Benefits of Using Tools to Analyze User Behavior
Analyzing user behavior provides a multitude of valuable insights that can enhance different facets of your business operations.
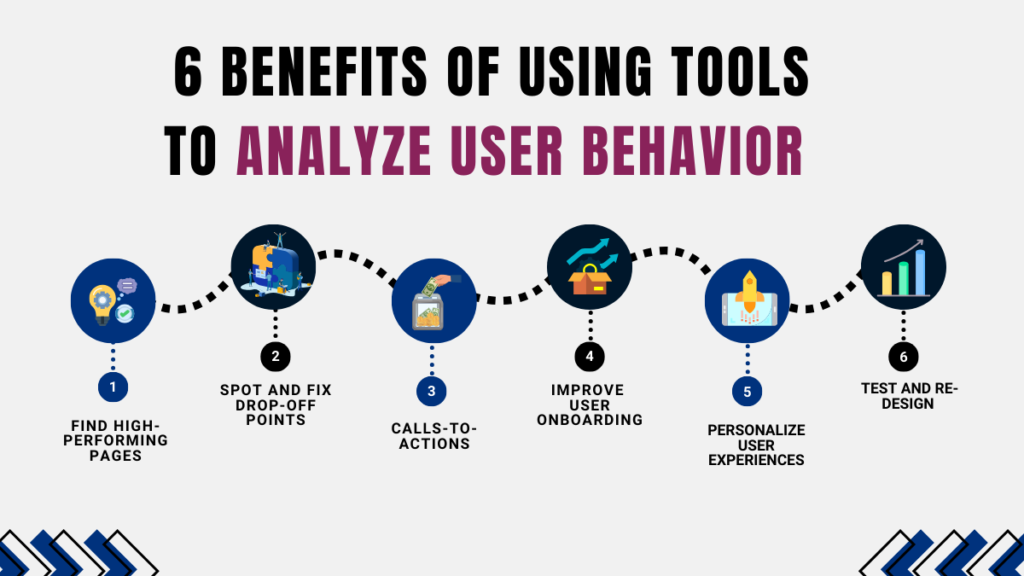
Below are some of the key benefits of leveraging tools designed to analyze user behavior:
1. Find High-Performing Pages
By using behavior analytics, I learned which pages on my website got the most attention. I looked at data like how long people stayed, bounce rates, and conversions.
2. Spot and Fix Drop-Off Points
Behavior analytics tools like heatmaps and session recordings can reveal where users abandon your site or app. For example, if users often leave during checkout, simplifying the process can reduce cart abandonment and improve conversions
3. Calls-to-Actions
If some CTAs aren’t getting enough clicks, test different placements, colors, or wording to see what works best. Even small changes can improve click-through rates and deliver better results.
4. Improve User Onboarding
In apps or websites, behavior analytics can show where new users face challenges during onboarding. Identifying these friction points is key to smoothing the path and helping users reach that “aha” moment faster. Plus, having clear data makes it easier to demonstrate to stakeholders where changes are necessary.
5. Personalize User Experiences
Use behavior data to group users by their actions, preferences, or demographics. This lets you provide personalized content, recommendations, or offers, boosting engagement and building loyalty. For example, you can show tailored product suggestions to frequent shoppers or highlight relevant features to new users.
By understanding what different user groups need, you can create more meaningful interactions. Over time, this personalization strengthens the connection between users and your platform.
6. Test and Re-Design
Behavior analytics allows you to test different designs, layouts, or features (A/B testing). By seeing how users react to each version, you can pick the best-performing option. Comparing user behavior between versions helps you quickly identify what’s effective and what’s not.
This data-driven method lets you make smart choices, avoiding guesswork. Over time, you can refine your platform to better match user preferences.
Conclusion
UBA turns confusing data into clear steps to make your website/app easier, faster, and more enjoyable for users.
1. Understand Users Better
Track clicks, scrolls, and exits to see how people use your website or app. This helps you find and fix problems (like confusing pages) to make the experience smoother.
2. Tools to See User Struggles
Use tools like heatmaps (colorful visuals showing popular areas) and session recordings (video-like replays of user actions). These show where users get stuck, what they like, and how to improve their experience.
3. Boost Sales & Sign-Ups
By monitoring user behavior, you can highlight key buttons (like “Buy Now” or “Sign Up”), streamline the checkout process, and improve onboarding for new users. This boosts sales and improves user satisfaction.
4. Decide Using Facts, Not Guesses
For example, test different page designs, personalize content, or update layouts based on what users actually do.
5. Useful for Everyone
UBA helps teams (product managers, designers, marketers) work together. It improves user interaction, fixes issues, and helps reach goals like more sales or happier customers.
FAQs
What is User Behavior Analytics (UBA)?
User Behavior Analytics (UBA) is about gathering and studying data to see how people use a website or app. It helps identify patterns, friction points, and opportunities to improve the user experience.
Why is User Behavior Analytics important?
UBA provides actionable insights into user actions, such as clicks, scrolls, and exits. This helps businesses identify and fix issues, improve user experience, and increase conversions.
Who is Behavior Analytics For?
Product Managers, Website Owners, Data Analysts, UX Designers, CRO (Conversion rate optimization) Managers, Digital Marketers
What tools are used for User Behavior Analytics?
Common tools include session recordings, heatmaps, and event tracking. These tools help visualize user interactions, such as clicks, scrolls, and navigation patterns.
How do session recordings help in understanding user behavior?
Session recordings show real-time user interactions, including clicks, scrolls, and navigation. They help identify usability issues, such as confusing design elements or drop-off points.
What are heatmaps, and how do they work?
Heatmaps use colors to show where users interact most on a webpage. Red indicates high activity, while blue shows low activity. They help identify popular areas and sections that users ignore.
How can UBA improve goal conversion rates?
By analyzing user behavior, businesses can identify bottleneck.